After the Bush/Shoe incident, anyone who’d spent even a few moments in eccentric corners of web knew there would be a creative response online. And it came. Wired has a summary of the shoe-inspired games and animations.
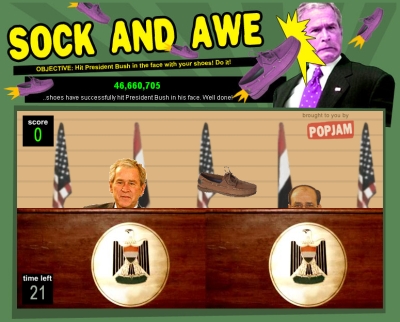
So Sock And Awe wasn’t the only Flash game based on the Bush/Shoe event. But it was the best.
Now Alex Tew, its creator, has sold the site as a property on eBay for £5,215. Whichever way you look at it, that’s a good rate for a few hours of work – not to mention the email subscribers he gathered, which were not part of the sale.
Rory Cellan-Jones at BBC News has the details of this high speed micro-start-up.
As Cellan-Jones notes, the site is based on a current affairs event and will now rapidly decline in value. It’s up to the new owners to extract value from it.
But this doesn’t detract from the cheek and verve of Tew and his colleagues. Everything from the choice of name to the design to the speed of launch and then the one-day auction was executed with skill. See also: his Million Dollar Homepage. If you’re curious about his next move in the world of the web, check out Tew’s forthcoming start-up PopJam.
While the Sock And Awe site was being auctioned, I contacted Tew and asked to see the full visitor stats, via Google Analytics. The visitor counts and top countries were already generally known, but I wanted to see precisely what was happening.
Now that the sale has closed and people are chatting about it, the full analytics make interesting reading so I thought I’d post them up here – with first some graphical highlights then the unexpurgated PDF dumps. (“After the jump”, if you will.)
It’s a good case study in site design and branding.
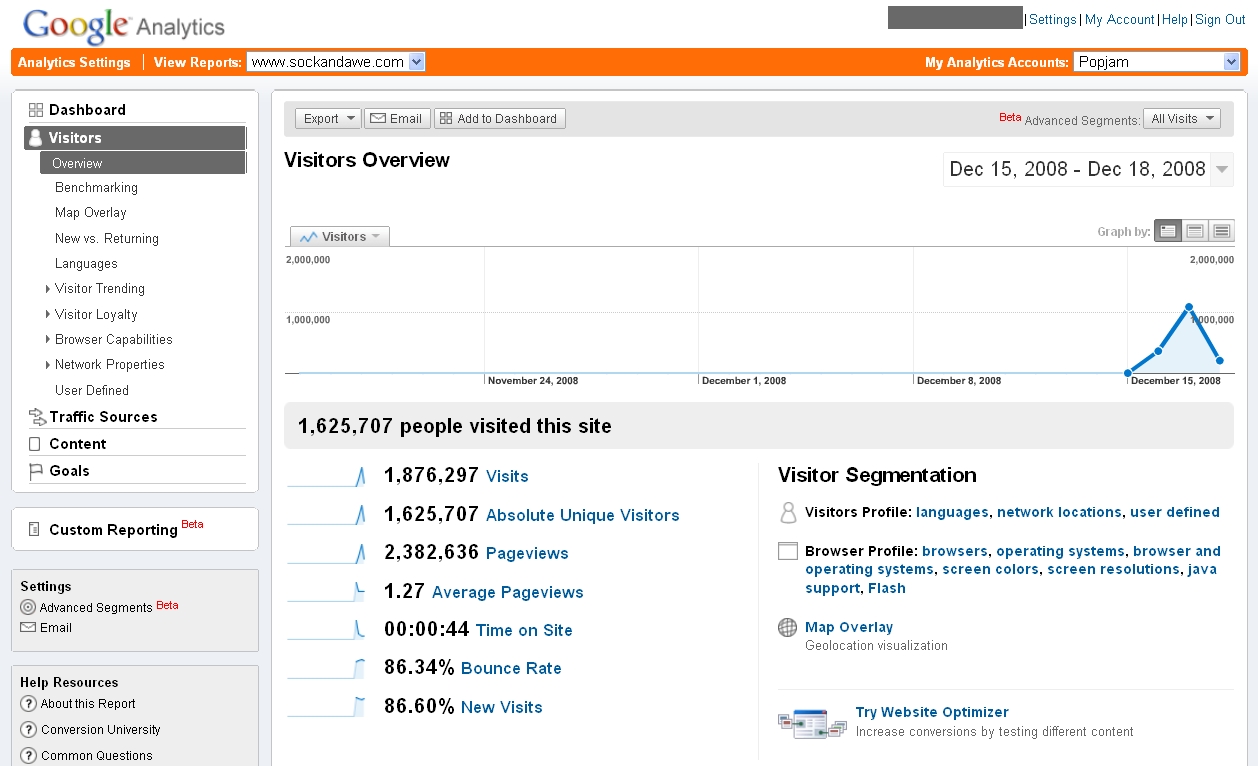
Sock And Awe – Visitors Overview
The bounce rate is high, which for the average site would normally be very bad. (In other words, most people are just looking at the homepage then leaving.) But Shock And Awe is mainly about the homepage, so it’s an exception to most sites.
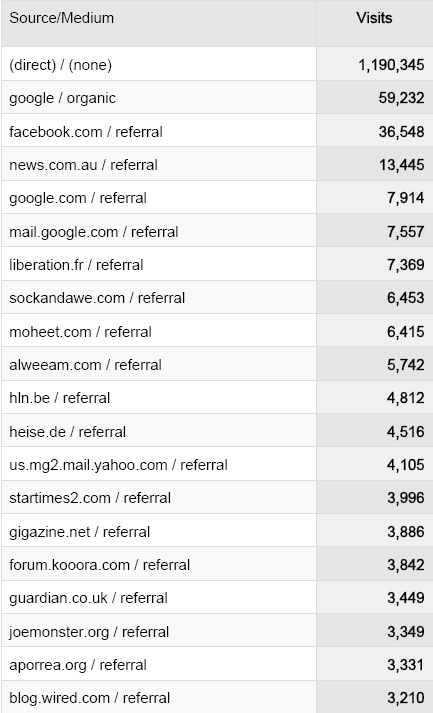
Sock And Awe – Top 20 Referring Sites (Detail)
Most visits are getting there by typing into the address bar. Far fewer are clicking to come from other sites. This shows the value of having a good web address that’s memorable and easy to spell. Notice I said “visits” rather than “visitors” (uniques). As you can see from the New vs. Returning PDF, 13% of them are repeat visitors, presumably returning to play again.
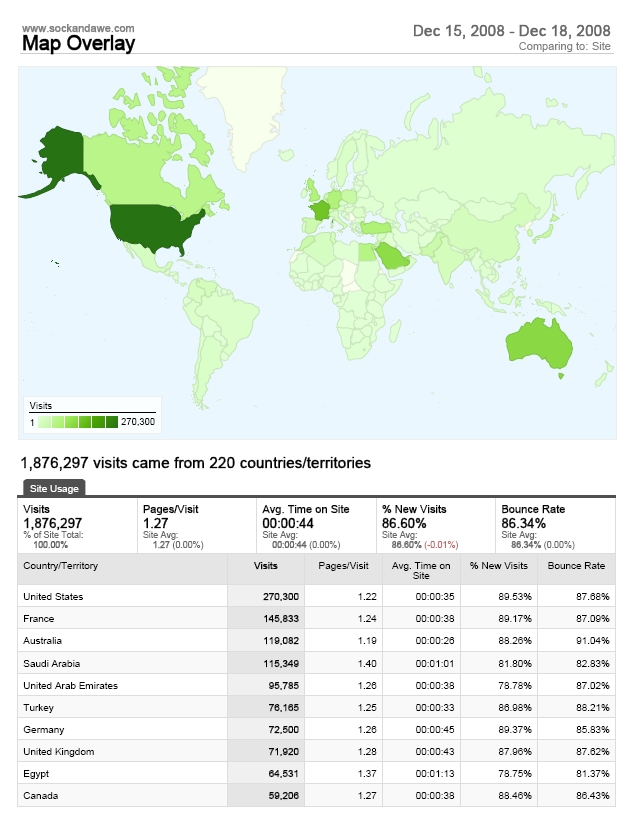
Sock And Awe – Map of Visitors
An unusual sign of accord between USA and France, who occupy the top two spots. Google Analytics also records “not set” for country unknown but this is much further down the chart at position 42. Middle Eastern countries can’t get enough of the Bush bashing, as you can see from the full countries PDF
All of the analytics in my blog post here were taken at around 6:15AM GMT on Thursday 18th December. As you can see, the graphs and figures plummet on the 18th because they’re not showing a full day’s stats. It may be better to disregard that day’s totals and regard all analytics as a snapshot showing qualitative insights.
Grab the ZIP file of all sockandawe.com analytics. Or view individual pages below.
Dashboard
This is the overview data.
Dashboard
Visitors
Check out Time on Site for All Visitors – the earlier visitors have much longer attention spans!
Visitors Overview
Map Overlay
New vs. Returning
Languages
Visits
Page Views
Absolute Unique Visitors
Bounce Rate
Time on Site for All Visitors
Traffic Sources
As I mentioned before, the direct traffic is by far the largest. With no time to mount an SEO campaign, Sock And Awe still captures some keyword search traffic, again thanks to the memorable name. (Google and other engines recognise matches with the domain name.) It also captures a few who mistakenly type the URL into their search bar instead of their address bar. (Incidentally, you may be wondering why my own personal blog is called, of all things, Quixotic Quisling. Well, I like to play the long game.)
Traffic Sources Overview
All Traffic Sources
Direct Traffic
Referring Sites
Search Engines
Search Keywords
Content
Content analytics are perhaps the least interesting because this site has very few pages. Although Top Content does give a hint how many people attempted to sign up for the newsletter – at least 30,000 it would appear. (After signing up, they arrived at sockandawe.com/email for a confirmation message. This folder has now been removed.) I say “attempted to sign up” because my own experience is that many people try search queries in these boxes, even despite clear labelling. Tens of thousands is still a good order of magnitude, even if half are bad. Many of the web addresses listed in Content account for framed visits (one recognisable example is somebody using Babelfish, in vain, to attempt to get a translation).
Content Report
Top Content
Top Landing Pages
Top Exit Pages
Average Pageviews
Quick word on Development Costs
According to reports, the game took a night to build. The game engine is very simple – if you think about it, it just compares the X-position of the mouse cursor (which is invisible) with the random X-position of Bush’s head graphic. If the distance is within a pre-set striking tolerance, then the whack graphic is shown. I would say the most time consuming part of the Flash game development was designing the graphics and animation.
Similarly, the bandwidth costs would be low. If you run the site through an analyser, it’s currently around 200kb of data. The site has been slightly modified to remove the subscription option and add advertising, but these are not big changes.
Discussion
Can you glean any more significant insights from these stats? You can comment or send me a message on Twitter.